Thursday, May 15, 2014

Gamescore

Simple Gamescore for Dota 2

When I first started watching Dota one of the most confusing things was trying to figure out who had the advantage. One would assume, at first, that kill count is the end all be all. However; That assumption quickly falls apart once you see a team with fewer kills convincingly win a game. So, to address this question I turned to 2 of my favorite past times: chess and baseball.

In chess the use of computers to assess the state of the game is now the norm. The computers are great at brute force calculation, but programmers also direct the computer by giving certain positional situations a - or + value. The read out and scaling of the engines is what we are going to use. In a chess game a score of 1 would mean the white is 1 pawn ahead of black. A score of -3 would mean that black is 3 pawns ahead. We will use this same idea, with positive numbers being the radiant and negative being the dire. In chess the scale is by pawns, in Dota we will use kills.

From baseball we will take the titular name for this stat. Gamescore was a statistic developed by Bill James to evaluate how well a starting pitcher pitched in a particular game. He gives value to almost everything that a pitcher does. For instance: a strikeout is one point, an out is one point, giving up a hit is -2 points etc. This is a really wonderful idea for many reasons, but one of my favorite things about it is how simple it is to keep track of. I can quite easily keep track of this statistic in my head while watching a game live, since it is just simple addition and subtraction.

So! The parameters I set myself for this statistic were: be simple to keep track of, have an output that describes the state of the game that is simple to understand. Now, before we go to the nitty gritty lets have a few caveats. This isn’t perfect, it is a very simplistic take on the game. It doesn't take into account many things that affect the game. This formula was something that took me a long time to come to, for awhile I had many more categories and the numbers were more confusing. For example, how do you quantify a courier kill? It is difficult to do and it depends many things; when in the game it happens, what items were on the courier, who killed it etc etc. I decided that questions like this were above the scope of a simple stat like this. In a future blog post I will detail a much more complex algorithm that will deal with questions like those and be more like a chess engine readout. For now lets get to Simple Gamescore.

Here are all of the values you need to know:


                       Kill
1
Tier one tower
1
Tier two tower
2
Tier three tower
3
Tier four tower
5
Rax
4
Roshan Kill
1
Aegis
1
Cheese
1

That’s it, simply add up the scores for both sides that subtract radiant-dire.

The first test for this is to see if the team that wins always has the higher gamescore. This can be a little tricky due to teams being able to call gg whenever they want. You can imagine a team throwing a game and calling gg before the gamescore has time to catch up. Even in this case the score should get at least close before the game ends.

Lets talk about range, how much of an advantage in gamescore does a team need to win? Here are the very approximate numbers that I’ve come up with from running gamescore on about a hundred games.


Points ahead
Advantage
0 to 5
Even
6 to 10
Slight advantage
11 to 15
Large advantage
16 to 20
Huge advantage
20 and up
Game over

One more thing I should say about this is as the game goes longer the score needs to be higher for the team to win. A 10 point lead in the first 10 minutes means a lot more than a 10 point lead 50 minutes in.

To begin our examples here are the results of a few recent games. In the interest of not driving the author crazy, these are not perfect. DatDota does not provide details on Roshan kills. Even with that part of the equation left out you will see that Gamescore still shows the winners, which is the real point of this section.


Match ID
Teams
Final Gamescore
Result
564209414
C9 - Liquid
-51
Dire
561178523
EG - For Sweet
32
Radiant
562305704
Sigma - Empire
-31
Dire
563999328
EG - VG
22
Radiant

Of course this start isn’t as interesting after the game, it is during the game that we want to know the information. Here are a few charts of the final game of TI3.


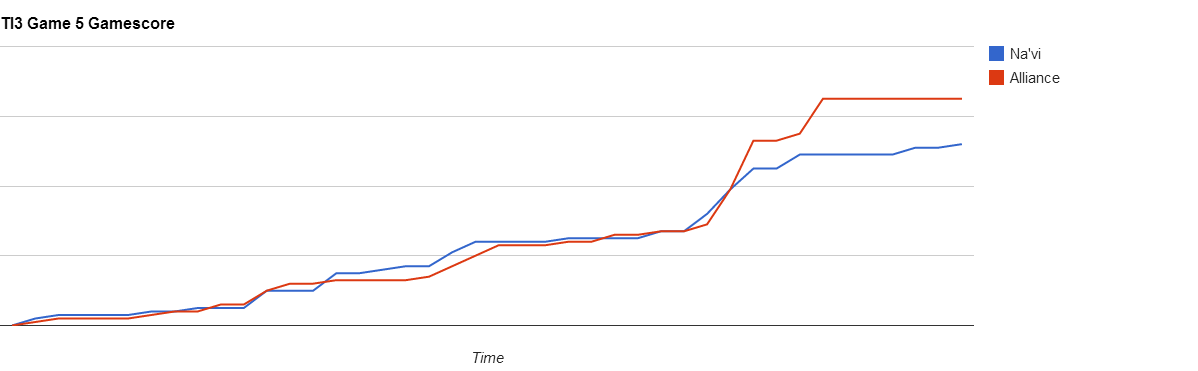
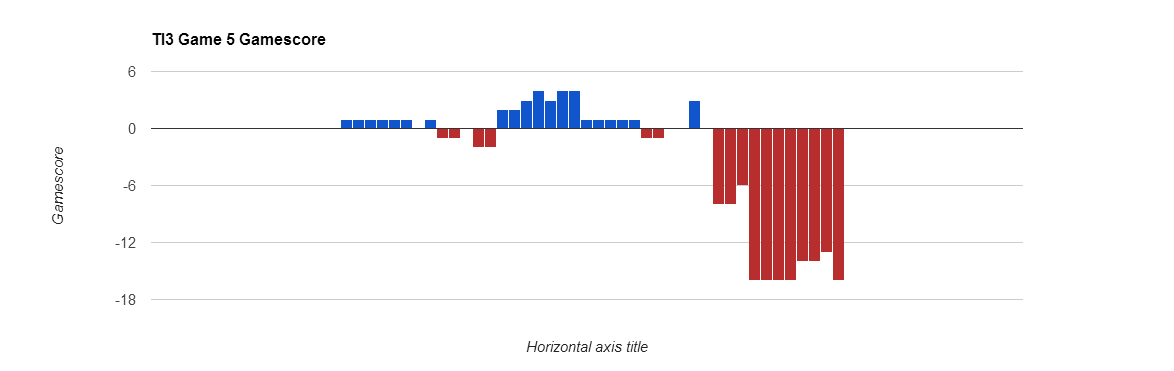
The first chart is simply the total game score for each team during the game. The second is the radiant - dire score which I mentioned earlier. In a perfect world I would have a program that could record the gamescore at each moment in the game and then translate that to a graph. Since I don’t have that I took the score from each minute in the game. This, sadly does not allow the graph to capture the effect of the ‘million dollar dream-coil’. The minute that the dream-coil happened was directly after the last blue spike you see on the graph. What the graph doesn't show is that Na’vi had grown their gamescore lead to 10 points in that minute, and the dream coil alone brought it back down to 4 in a matter of seconds. The first big jump of red is when the Rax go down, quickly followed by the next big jump which was the tier 4 towers. In the middle of the graph you can see the small advantage Na’vi had built, the steep drop of the blue there is the s4 aegis steal.

Hopefully this shows how effectively this simple system can show viewers of the game what is going on. It is also useful in showing where the most important moments of the game happen. This is helpful not only to new players who might not know what is going on, but could allow casters to easily find the exact moments where they should show a replay after the game. I hope you find this statistic as useful as I do! Next time we will talk about the theory of making a much more complicated version of gamescore, that could be even more useful to the wider community.


Thursday, February 13, 2014

Impact: Who to Watch


This is the first article in a series I’m creating on advanced Dota statistics. Being a fan of advanced baseball statistics (SABER), I have always been disappointed with the quality of statistics available in Dota 2. The main problem is that most of the stats available and shown on broadcasts don't actually tell us much. This is because most of the numbers are what people in the stats business call ‘counting stats.’ For instance, in Dota 2 some counting stats would be K/D/A, wins as a certain hero, wins when an item is gotten before a certain time, etc. The core of advanced statistics is taking these counting statistics and dividing them by another number. In this article I’m going to dive into a new stat I've developed that I call Impact. Let’s get started.


Most good statistics, in my opinion, are based on a good question. For Impact I used one of the simplest I could think of: “Who was the best player in the game?” which I later changed to “Who had the most impact on this game?”  I also thought it would be nice if the number gave you a clue on who to watch in a replay.  An ‘entertainment value’ if you will.


To explain the method of calculation I first have to explain two fairly simple concepts: weights and positional adjustment.


Weights are simple; they are saying not everything is equal so we shouldn't treat them as such. So my first goal was to assign weights to the basic K/D/A. Here are the numbers I decided on:


    Kill
1.75
Death
1.1
Assist
0.75


Using this we can get our first player ranking number like this: ((Kills*1.75)+(Assists*.75))-(Deaths*1.1). In the final formula I will call this number KDA. Now, there is a big problem with this, as I’m sure some of you will notice right away: it favors carries and semi-carries way too much. To help fix this we will use something called positional adjustments (in the final formula this will be called PA). The basic idea of positional adjustment is that some positions are harder to play than others. So, we will again use weights to give each position a number. Here I am using the traditional roles, but would like to have positional adjustments for all lane configurations eventually.


                 Carry
1.35
Solo Mid
1.75
Solo Offlane
1.8
Support
1.5


Are these perfect? Probably not, but I think they are a good starting point. At first I thought that would be all we would need for Impact, but I spotted a problem with the formula: carries were actually penalized too much. I realized I was missing a large part of what carries do: hurt towers. Therefore I decided to add tower damage into the formula. I did this like so: ((TowerDamage*2)/1000). Here I divide by 1000 to get a number that will be closer to the numbers in the K/D/A. In the final formula I will call this TD.


So what does all of this get us? Here is the formula:


((KDA+TD)*PA)/10


Here dividing by ten is just giving us a smaller number to work with.  All numbers from here on out will be rounded up to the nearest hundredth...unless I forget.  


So let’s get to an example!
Here are the Impact scores from the recent game Sigma - Fnatic match id: 512566540


Sigma
Impact
             Sockshka
2.29
FATA
1.86
miGGel
5.41
7ckngmad
1.51
paS
2.31


Fnatic
Impact
                     Era
1.14
H4nn1
1.42
Trixi
0.32
N0tail
1.07
Fly
-0.08


So what can we learn from this? First, we can see the miGGel went bonkers and if we were planning on watching a replay we would keep an eye on him. Second, we can also see where things went wrong for the other team- Fly had a bad game and Trixi was abysmal. Thirdly, we can see how important supports are, with both of Sigma’s supports getting the better of their counterparts, especially in the 5 position. With paS, seeing how high miGGel’s score is, we can safely assume that he got quite a few assists, possibly while teaming up with miGGel.  Let’s have another example. Here are the scores from game 5 of the grand final of Ti3:


Na'Vi
Impact
                 XBOCT
2.54
Dendi
6.45
Funn1k
1.20
Puppy
1.68
KuroKy
0.63


Alliance
Impact
                    Loda
2.06
s4
1.73
AdmiralBulldog
4.71
EGM
2.08
Akke
0.06


From examining this we can learn a few things. First, remember that stats like these do not measure individual plays. We all know s4 had the single most impactful moment, but that doesn't show up here. Second, Dendi was awesome in the game, but I think people might be surprised at how high Bulldog’s score is. This can be explained simply; since we included tower damage the full impact of how good Bulldog’s rat dota was can be seen. Thirdly, Funn1k...oh Funn1k. Let’s try out something else using this formula.


I used www.datdota.com to see player’s stats from the 13’-14’ season, as this should show us the most impacful players on the scene right now. Also note that this will use averages for the counting stats. Here are the player rankings from just a few of the top teams (as of the 9th of February). THIS IS NOT EVERYONE:


Player
Impact
Games Played
                Arteezy
3.4
43
Super
3.22
130
SingSing
2.97
93
Era
2.86
106
Loda
2.83
155
AdmiralBulldog
2.79
158
Dendi
2.76
155
H4nn1
2.76
176
Ferrari_430
2.72
125
mushi
2.71
131
s4
2.66
165
Hao
2.62
125
XBOCT
2.61
155
Sylar
2.59
87
EternalEnvy
2.58
145
BurNIng
2.56
130
Universe
2.5
133
YYF
2.33
125
bOne7
2.25
134
Funn1k
2.24
161
Trixi
2.18
76
iceiceice
2.04
131
zai
2
68
Fenrir
1.79
134
Aui_2000
1.71
154
Puppy
1.69
166
MMY
1.69
130
Faith
1.66
122
rOtk
1.61
130
Fear
1.58
133
LaNm
1.55
130
EGM
1.52
169
Akke
1.51
159
KuroKy
1.49
107
Banana
1.48
120
N0tail
1.45
166
pieliedie
1.38
147
Fly
1.37
109
ppd
1.34
81


Keep in mind that we are using only one set of positional adjustments, so this chart isn't perfect.


From this we can see that over time the carries and semi-carries are pretty much always going to be the most impactful.


This chart also brings up something important to remember when looking at any statistic: sample size. The smaller the number of games played, the less accurate the numbers are. This is why in sports such as baseball you have to have a certain number of games played, at bats, innings pitched, etc. in order to qualify for awards. Arteezy has played half the number of games as the other players on the list, which is why his number is probably inflated while ppd and Fly’s are probably a little low. Remember the more games played, the more accurate the number. This isn't a knock on any player, but just a truth of statistics.


More than anything I hope this new stat begins to start a dialogue about improving the quality of Dota 2 statistics. With all the raw numbers we have at our disposal, the number of meaningful stats we can glean from them is nearly endless.


If people are interested, I can share a template spreadsheet that people can use to calculate Impact on their own. Also keep in mind that I did all of this by hand, so there may be mistakes.

Stay tuned for the next article where we tackle another simple question: “Who is winning this game?”